MS Excel - Example No. 5
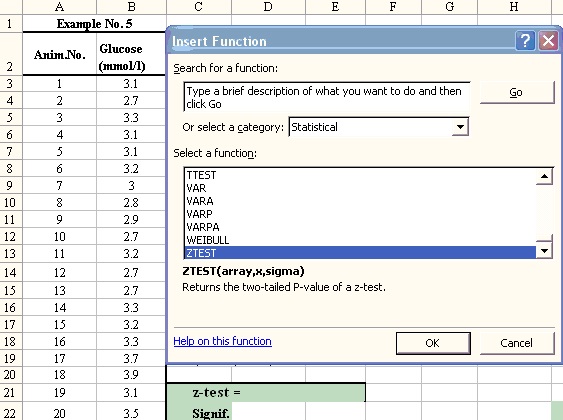
1. Input sample data into a table (cells B3:B22); calculation of one-sample t-test: call menu Insert - Function - Statistical - ZTEST (a specific variant of t-test used for comparison of sample mean with the known population mean):
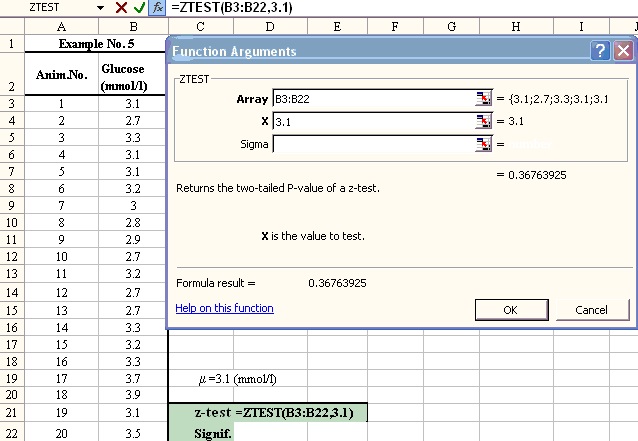
2. Into field Array in dialog window input cells for calculation - B3:B22 (it is possible to mark them by means of mouse), into field X input the known mean value of population =3.1; push the button OK to get result:
3. Displayed results of calculations:
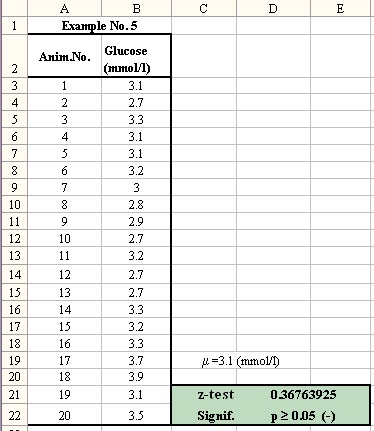
4. Result of z-test (one-sample t-test): p=0.36763925 indicates probability of null hypothesis about equality of means (= probability of a error). As calculated p > 0.05, it means that difference between tested means is statistically insignificant (sample comes from the population with the mean value =3.1 mmol/l).
Conclusion: As the difference between means is statistically insignificant (p>0.05), preparation doesn´t influence the glucose level in blood serum of horses.