MS Excel - Example No.8
1. Input data of control and test sample into a table (e.g. cells B3:B12 and C3:C12); calculation of mean value (average) of samples: in cells B13 and C13 call menu Insert - Function - Statistical - AVERAGE; calculation of standard deviation (SD) for samples: in cell B14 and C14 call menu Insert - Function - Statistical - STDEV (see examples 1, 2).
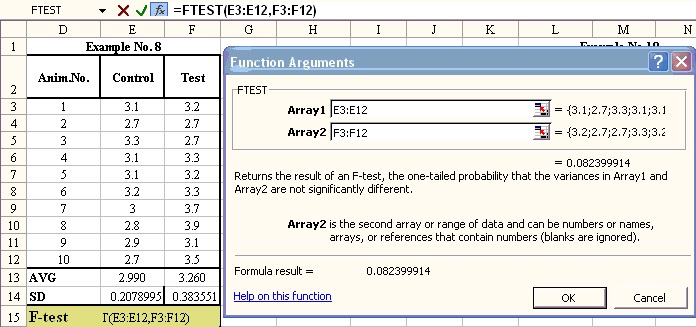
Calculation of F-test (test for differences between variances): in the cell B15 call menu Insert - Function - Statistical - FTEST. Into field Array 1 in dialog window input cells for calculation - B3:B12, into field Array 2 input cells C3:C12 (it is possible to mark them by means of mouse), push the button OK to get result:
2. Displayed results of calculations:
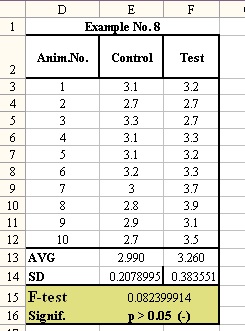
3. Result of F-test: p=0.0824 indicates the probability of null hypothesis about homogeneity of variances (= probability of a error). As calculated p > 0.05, it means that difference between variances is statistically insignificant (H0: s1=s2 is true).
Conclusion: As difference between variances of control and test groups is statistically insignificant (p > 0.05), the preparation tested doesn´t influence the variance of the glucose level in blood serum in horses.